Equality characteristics
Reviewed: 01/03/2023
Jump to:
- Age
- Sex/ gender
- Gender reassignment/ gender identity
- Race
- Religion or belief
- Disability
- Marriage/ civil partnership
- Sexual orientation
- Pregnancy and maternity
- Caring status
- Socioeconomic status
- Veterans
Background
Public sector bodies need to be able to evidence that they have given due regard to the impact and potential impact on all people with protected characteristics in shaping policy, in delivering services, and in relation to their own employees. See Bolton Council's equality downloads for the latest equality strategy and graphic describing Bolton's population in terms of equality characteristics.
Under the Equality Act 2010, there is a general duty to have due regard to the need to:
- Eliminate unlawful discrimination, harassment, victimisation and any other conduct prohibited by the Act;
- Advance equality of opportunity between people who share a protected characteristic and people who do not share it; and
- Foster good relations between people who share a protected characteristic and people who do not share it.
The census is a key source of information on all of these characteristics. The ONS has produced a range of useful tools to help you use census data. Also see the Neighbourhoods page of this website for other sources of small area information.
The Government Statistical Service harmonisation guidance provides standard ways of asking about and reporting on many of these characteristics and more topics, which will help us accurately use information from different sources.
When considering equality, it can be useful to also consider the concept of equity. The cartoon below explains the difference well, but essentially it is the difference in focus between equality of inputs and equality of outputs. Offering everyone the same opportunity is not truly fair if other factors mean that some people are less able to take it up or benefit from it.
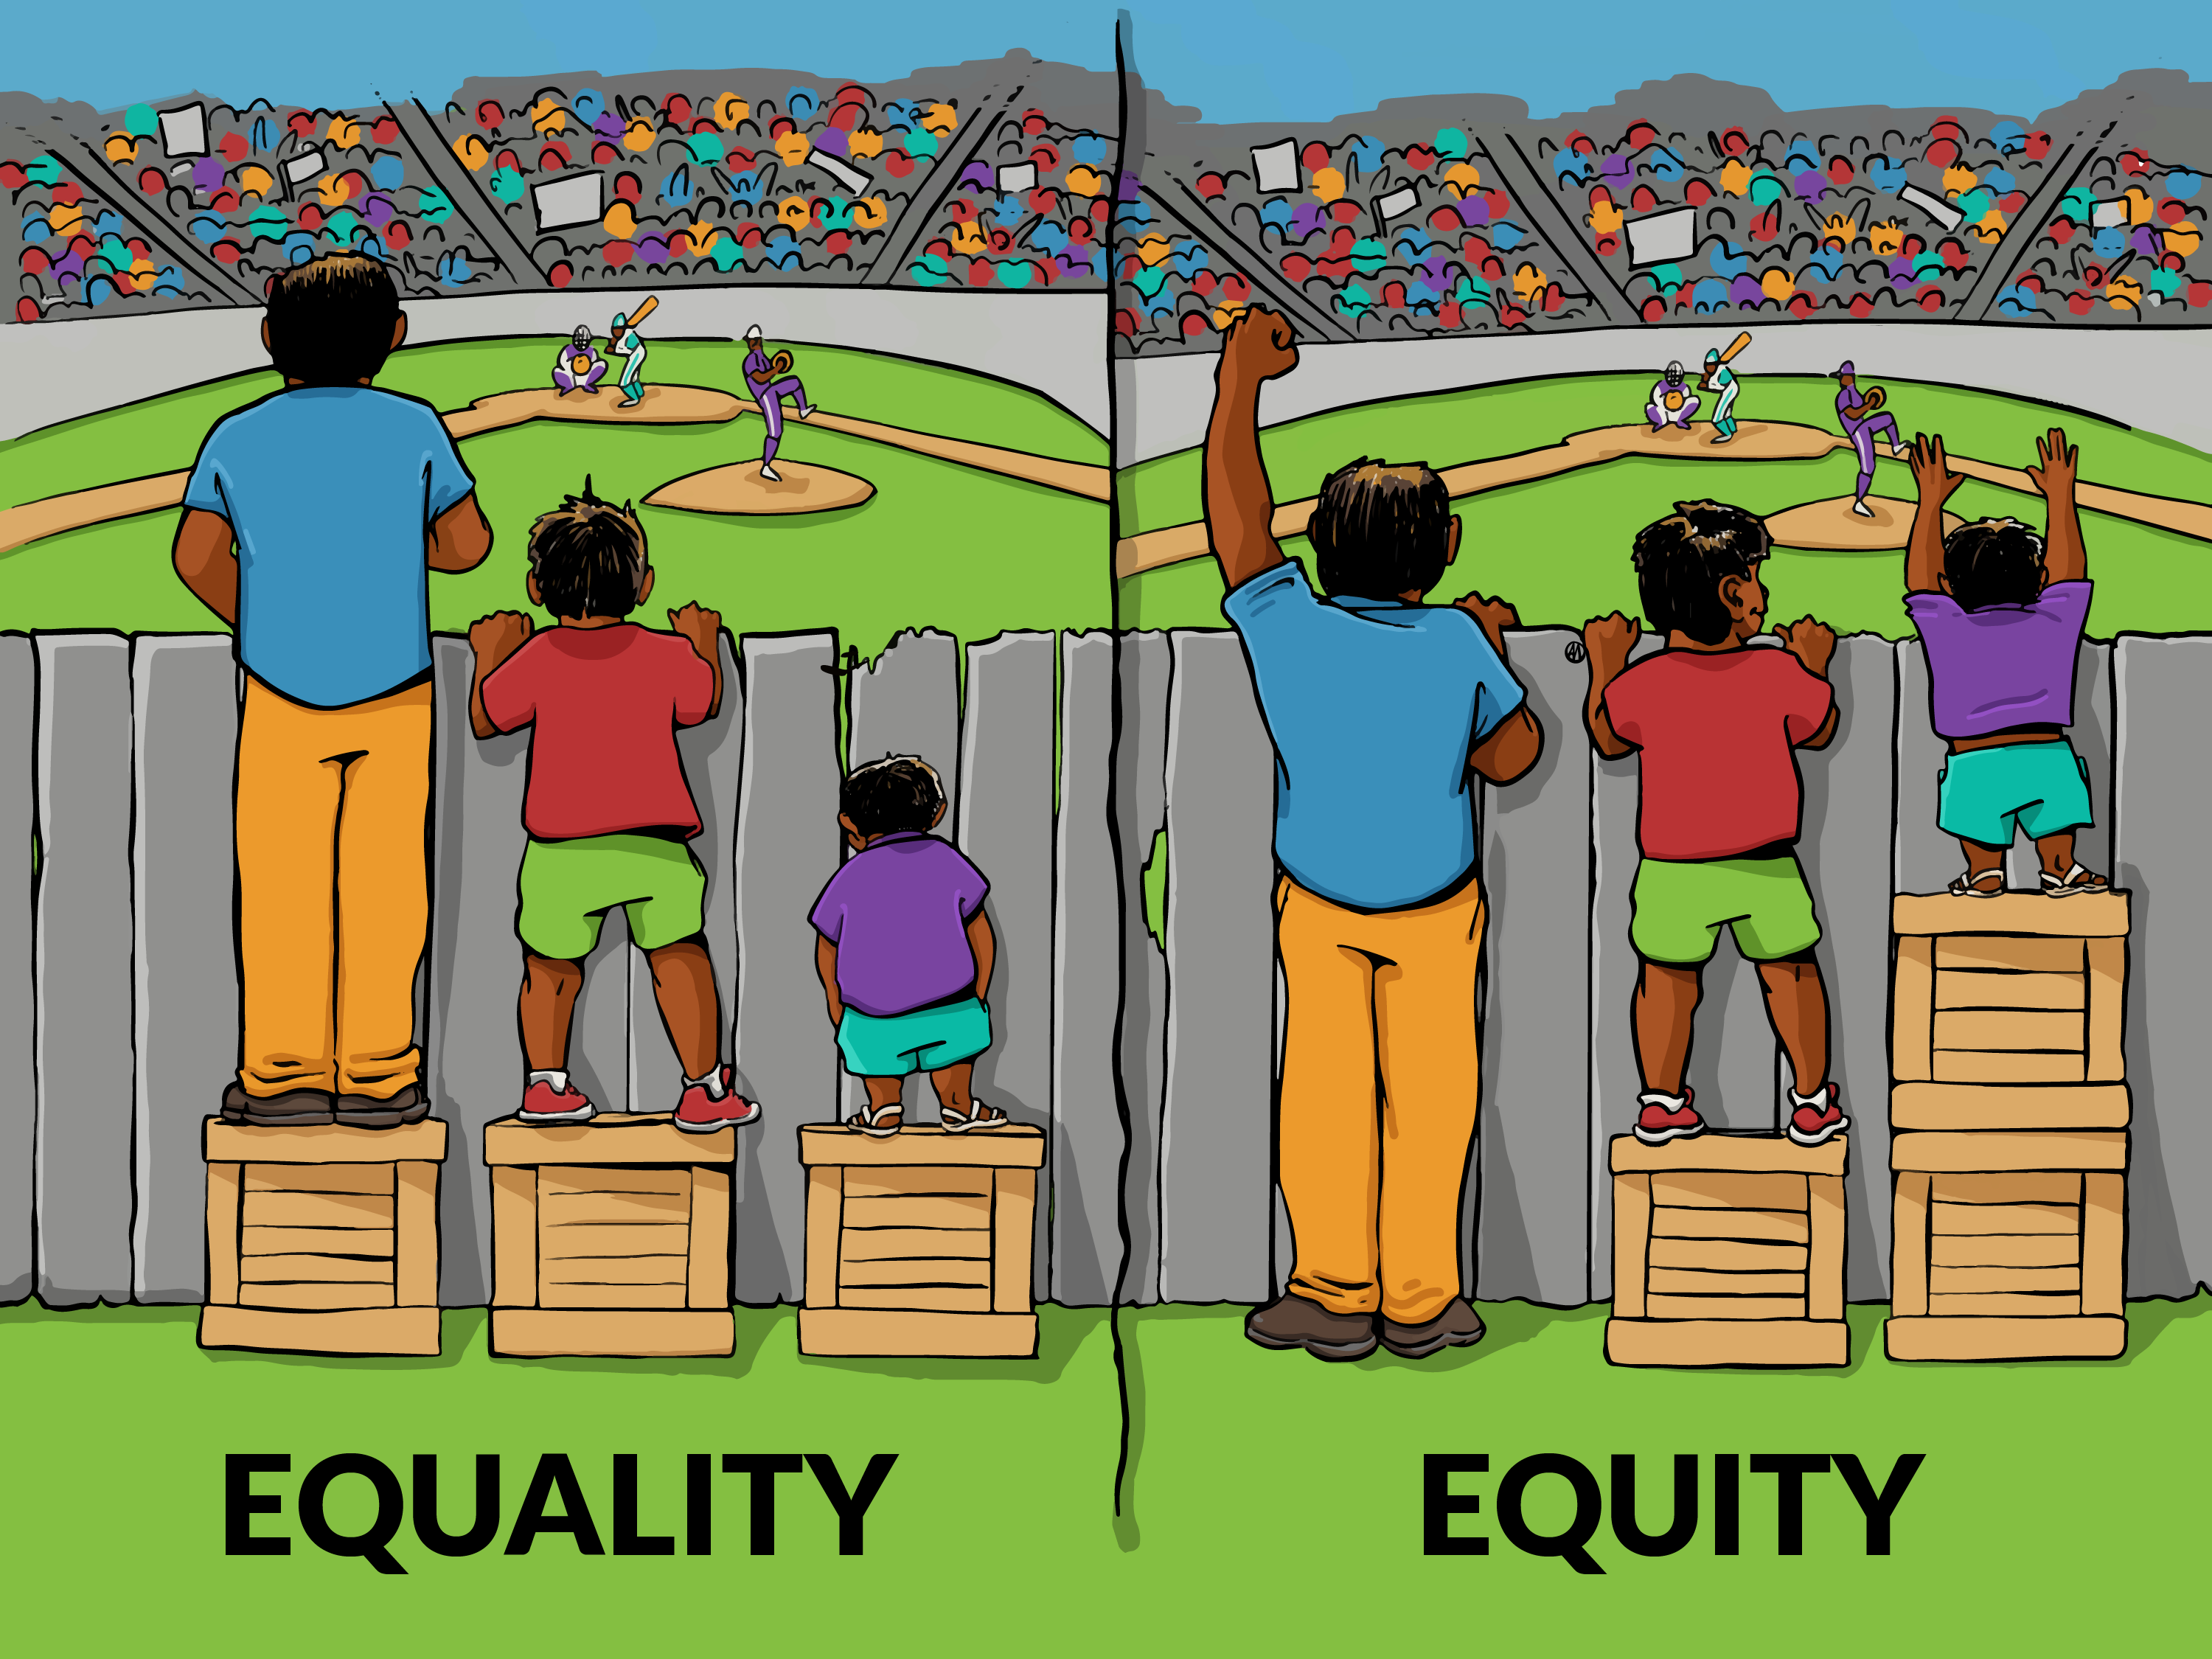
Image from: Interaction Institute for Social Change | Artist: Angus Maguire.
Age
On Census Day 2021, Bolton's population was 296,000. 26% (78,000) were aged 19 or under, while 17% (50,800) were aged 65+.
- Also see the population section of this website.
Sex/ gender
On Census day 2021, 49.3% of the Bolton population was male, while 50.7% were female.
- Also see the population section of this website.
- Women of the North - an overview of a wide range of gender based inequalities in the North of England
Gender reassignment/ gender identity
A person whose deeply felt and individual experience of gender may not correspond to the sex assigned to them at birth, they may or may not propose to, start or complete a process to change their gender. A person does not need to be under medical supervision to be protected
Using 2021 census data, 0.6% of people aged 16+ living in Bolton had a gender identity different from their sex egistered at birth. 'No specific identity given' was the most frequent response at 0.3% of the 16+ population. This question was optional, and 6% chose not to answer.
Further information:
- Sexual orientation and gender identity data combining multiple variables, England and Wales: Census 2021
- ll-cause and cause-specific mortality by sexual orientation, England and Wales - from ONS
Race
This includes ethnic or national origins, colour or nationality, and caste, and includes refugees and migrants and gypsies and travellers
Bolton is richly diverse with 31.2% of the population from an background other than 'White: English, Welsh, Scottish, Northern Irish or British'.
Looking at the broader ethnic groups, 71.9% of the Bolton population is from a White background; 20.1% are from an Asian, Asian British or Asian Welsh background; 3.8% are from a Black, Black British, Black Welsh, Caribbean or African background; 2.2% are from a Mixed or Multiple background; 1.9% are from an Other ethnic group.
Looking at the more granular ethnic groups, most common in Bolton are 'White: English, Welsh, Scottish, Northern Irish or British' (68.8%); 'Asian, Asian British or Asian Welsh: Pakistani' (9.4%); 'Asian, Asian British or Asian Welsh: Indian' (8.9%).
These figures are obtained from the 2021 census.
- Also see the ethnicity section of this website.
Religion or belief
This includes any religion with a clear structure and belief system. Belief means any religious or philosophical belief. The Act also covers lack of religion or belief.
The most commonly reported religion in Bolton is Christian (47.0%), followed by no religion (25.8%), Muslim (19.9%), and Hindu (2.0%). This question was optional, and 4.6% chose not to answer.
These figures are obtained from the 2021 census. The census does not attempt to collect detailed information about the nature of their belief or the extent to which people practice their religion; it only asks which group an individual identifies themselves as belonging to.
- Also see the religion and belief section of this website.
Disability
A person is disabled if they have a physical or mental impairment which has a substantial and long-term adverse effect on their ability to carry out normal day-to-day activities
The social model of disability separates out the impairment from the environmental, behavioural or attitudinal barriers that impact on individuals; this is why we need to ask both about the health condition or impairment as well as the impact. For example a person may have a long term health condition that is well controlled with medication so they do not feel it has a significant impact on how they live their life, or equipment or adjustments may mean a person with an impairment considers they are able to do all the things they would want to do so the impact on their day to day activities is minimal.
Because levels of disability are higher among older people, the headline figures are often given adjusted as if all areas had the same population age profile - this is called age standardisation. You may prefer to use this figure when comparing areas as you can be confident that differences aren't just due to where older people live. Using age standardisation, 19.3% of the Bolton population have a long term health condition or disability which limits their day to day activities a little or a lot; so are considered to be disabled under the Equality Act. 9.3% of the Bolton population have a long term health condition or disability which limits their day to day activities a lot. These figures are obtained from the 2021 census.
Without this adjustment for population age profile, the figures are slightly lower as Bolton has a younger than average population. You may prefer to use this figure when comparing responses from a survey with the population figure for example. Without applying age standardisation, 18.1% of the Bolton population have a long term health condition or disability which limits their day to day activities a little or a lot; so are considered to be disabled under the Equality Act. 8.6% of the Bolton population have a long term health condition or disability which limits their day to day activities a lot. These figures are obtained from the Bolton census profile on NOMIS
The Family Resources Survey includes information on impairment type among disabled children/ working age adults/ adults of State Pension age, but this is not broken down below national level. An impairment is different to a medical condition. It looks at the functions that a person either cannot perform or has difficulty performing because of their health condition. For example, glaucoma is a medical condition but being unable to see or being partially sighted is an impairment.
Further informaation:
- Breakdowns of who has registered as being blind or partially sighted with Local Authorities in England is available from NHS Digital
- There is no national register of disabled peoeple. This briefing from the House of Commons Library explains more.
- People with long-term health conditions, UK: January to December 2019 - user requested data from the ONS
- Unheard voices experiences of D/deaf people when accessing health and care services - from Healthwatch Bolton
Marriage/ Civil partnerships
In 2019 (the latest year available), 544 marriages took place in Bolton, 529 to opposite sex couples, and 15 to same sex couples. In 2021, 16 civil partnerships took place in Bolton, 14 to opposite sex couples, and 2 to same sex couples.
From 2021 census data, 46% of people aged 16+ living in Bolton were married or in a civil partnership, 37% were never married or civil partnered, 9% were divorced or had a dissolved civil partnership, 2% were separated but still legally married or civil partnered.
Sexual orientation
Sexual orientation is an umbrella term covering sexual identity, attraction, and behaviour. For an individual respondent, these may not be the same. For example, someone in an opposite-sex relationship may also experience same-sex attraction, and vice versa. This means the statistics should be interpreted purely as showing how people responded to the question, rather than being about whom they are attracted to or their actual relationships.
From 2021 census data, 90.7% of people aged 16+ living in Bolton were heterosexual or straight, 1.2% were gay or lesbian, and 1.0% bisexual. This question was optional, and 7% chose not to answer
Further informaation:
- ONS pages on sexual identity
- Sexual orientation and gender identity data combining multiple variables, England and Wales: Census 2021
Pregnancy and maternity
Using mid-2021 population estimates there were 3,427 individuals aged under 1 year of age.
NHS Digital Maternity Services Monthly Statistics provides a range of information including births per month at the Royal Bolton Hospital.
Further information:
- Also see the population section of this website.
- Maternity and you experiences of maternity services in Bolton - from Healthwatch Bolton
Caring status
Because more older people are carers, the headline figures are often given adjusted as if all areas had the same population age profile - this is called age standardisation. You may prefer to use this figure when comparing areas as you can be confident that differences aren't just due to where older people live. Using age standardised 2021 census data, 9.8% of the Bolton population provide some form of unnpaid care, while 3.3% provide 50+ hours of unpaid care a week.
Without this adjustment for population age profile, the figures are slightly lower as Bolton has a younger than average population. You may prefer to use this figure when comparing responses from a survey with the population figure for example. Without applying age standardisation, 9.4% of the Bolton population provide some form of unpaid care, while 3.1% provide 50+ hours of unpaid care a week. These figures are from Bolton Census profile on NOMIS
Carers morsel of the month - April 2026
Socioeconomic status
A person’s socio-economic status (SES) is based on the type of work they do, or what they used to do if they are retired. It is similar to the concept of 'social class' previously used. It is measured by the National Statistics Socio-economic Classification (NS-SEC). NS-SEC can be reported using an 8, 5 or 3 class version, depending on the level of detail needed.
Using 2021 census data, the tables below show the breakdown of the Bolton population using the 8, 5 and 3 class models.
| 8 class name | Description | Proportion of Bolton population |
|---|---|---|
| 1. Higher managerial, administrative and professional occupations | L1, L2 and L3 Higher managerial, administrative and professional occupations | 9% |
| 2. Lower managerial, administrative and professional occupations | L4, L5 and L6 Lower managerial, administrative and professional occupations | 17% |
| 3. Intermediate occupations | L7 Intermediate occupations | 12% |
| 4. Small employers and own account workers | L8 and L9 Small employers and own account workers | 10% |
| 5. Lower supervisory and technical occupations | L10 and L11 Lower supervisory and technical occupations | 5% |
| 6. Semi-routine occupations | L12 Semi-routine occupations | 12% |
| 7. Routine occupations | L13 Routine occupations | 15% |
| 8. Never worked and long-term unemployed | L14.1 and L14.2 Never worked and long-term unemployed | 13% |
| 5 class name | Description | Proportion of Bolton population |
|---|---|---|
| 1. Higher managerial, administrative and professional occupations | L1, L2 and L3 Higher managerial, administrative and professional occupations L4, L5 and L6 Lower managerial, administrative and professional occupations |
29% |
| 2. Intermediate occupations | L7 Intermediate occupations | 12% |
| 3. Small employers and own account workers | L8 and L9 Small employers and own account workers | 10% |
| 4. Lower supervisory and technical occupations | L10 and L11 Lower supervisory and technical occupations | 5% |
| 5. Semi-routine and routine occupations | L12 Semi-routine occupations L13 Routine occupations |
27% |
| 3 class name | Description | Proportion of Bolton population |
|---|---|---|
| 1. Higher managerial, administrative and professional occupations | L1, L2 and L3 Higher managerial, administrative and professional occupations L4, L5 and L6 Lower managerial, administrative and professional occupations |
29% |
| 2. Intermediate occupations | L7 Intermediate occupations L8 and L9 Small employers and own account workers |
22% |
| 3. Routine and manual occupations | L10 and L11 Lower supervisory and technical occupations L12 Semi-routine occupations L13 Routine occupations |
32% |
| Additional categories | Description | Proportion of Bolton population |
|---|---|---|
| *Never worked and long-term unemployed | L14.1 and L14.2 Never worked and long-term unemployed | 13% |
| *Full time student | L15 Full-time students | 7% |
Often we use deprivation to approximate for SES as we can obtain this from knowing where someone lives. However deprivation is an area based measure rather than an individual or household measure as SES is. Deprivation is most often measured by the Indices of Multiple Deprivation (IMD)
Using 2020 LSOA population estimates, 26% of the Bolton population live in an area that is among the 10% most deprived nationally, while 56% of the population live in an area that is among the 30% most deprived nationally.
- Also see the deprivation section of this website.
Veterans
According to the 2021 census, 2.4% of the Bolton population previously served in the regular armed forces, and 0.7% in the reserve armed forces, while 0.1% had served in both.