Population
Reviewed 01/08/2025
Also see the following sections of this website:
- Equality characteristics
- Children and young people
- Ageing well
- Births, deaths and population movment
Bolton's current population
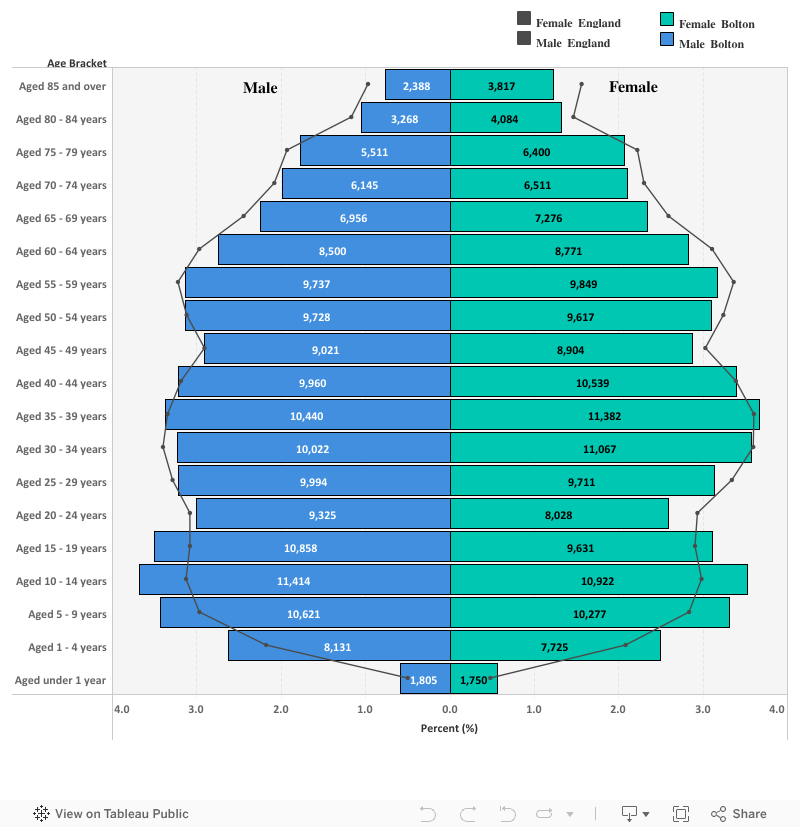
Using the latest (mid 2024) population estimates, Bolton's population was 310,085. Of these, 75,599 (24%) were aged under 18; 234,486 (76%) were aged 18+ and 52,356 (17%) were aged 65+.
Bolton has a higher proportion of young people under 18 than England as a whole, and slightly higher than Greater Manchester as a whole (Bolton 24%; GM 23%; England 21%). Bolton has a lower proportion of working age population (16-64), than England or GM (Bolton 61%, 191,000 people; GM 64%; England 63%). Bolton has a lower proportion of people aged 65+ than England but slightly more than Greater Manchester (Bolton 17%; GM 16%; England 19%). Greater Manchester has a higher proportion of adults aged 20-44 than England, but Bolton has a lower proportion of adults of this age (Bolton 32%, 100,000 people; GM 35% vs England 33%).
2024 mid-year population estimates
Bolton's future population
2022 based population projections are the latest principal projection. According to these figures, between 2025-2030 Bolton's population is expected to rise by around 3,200 people (1.0%). Between 2025-2035 Bolton’s total population will increase by around 7,100 people (2.3%), with Bolton expected to have around 317,000 (3.8% increase) residents by the year 2040 and 324,000 (5.5% increase) by 2045. This is a lower increase than we see for England or GM as a whole (2025-2040: Bolton 2.3% increase; GM 7.5%; England 6.6%).
By 2030, the population projections estimate that Bolton's population will get older. The early post retirement age group (65-75 years) is likely to see the largest increase. However the younger age groups are expected to change the most making up a smaller proportion of the population, with primary and secondary aged school children likely to see the largest percentage decrease.
Further forward, by 2040, the number of older working age residents, will make up the majority of Bolton's population; with older retirement (75+) age group showing a population growth of over 20% from 2025 to 2040.
Population projections at local authority level are especially subject to any limitations of the source data, as well as annual local fluctuations in those sources. In addition, actual local population change will be strongly influenced by local economic development and housing policies. Subnational population projections are not forecasts and do not attempt to predict potential changes in international migration. There is uncertainty over future directions and levels of international migration. Demographic assumptions for future fertility, mortality and migration are based on observed demographic trends. Resulting projections will differ to some extent from future releases of population estimates.
You should be cautious when comparing different areas’ exact numbers or growth rates. When using these figures to predict future service need they should be considered alongside other local knowledge such as planning allocations for housing growth and existing patterns of service usage.
Bolton population change, by age group, 2025 to 2030

Bolton population change, by age group, 2025 to 2040

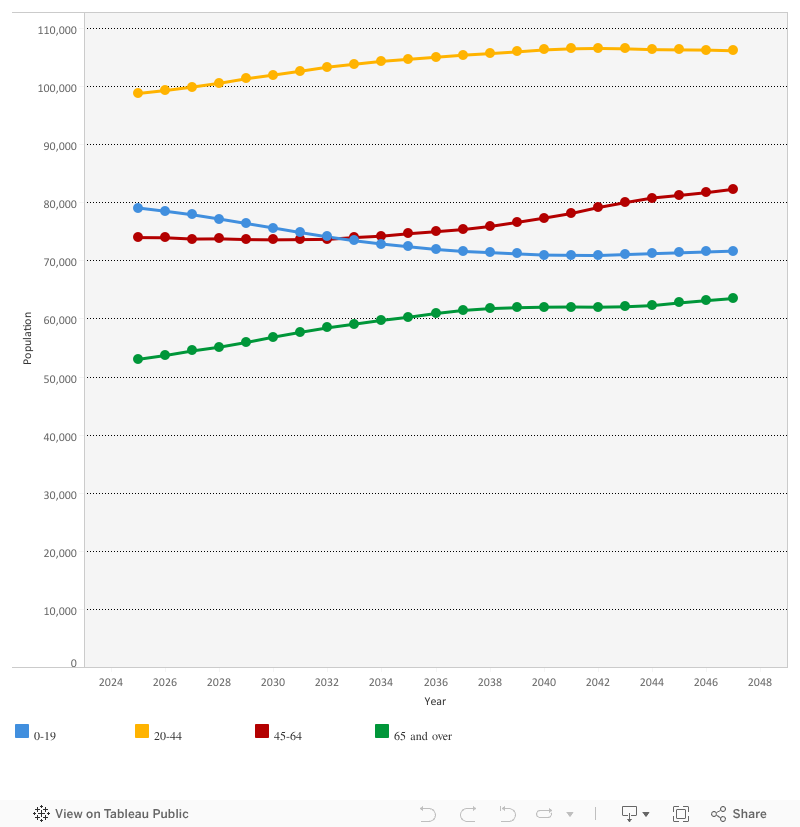
Bolton population projections, by age group, 2025 to 2047
The Bolton picture
- Population estimates - how many people currently live in an area, by gender and age.
- Estimates of the population for England and Wales - from ONS. Includes local authority, combined authority, and country.
- MSOA population estimates - from ONS. Middle Super Output Areas are a medium administrative geography, Bolton has 35.
- LSOA population estimates - from ONS. Lower Super Output Areas are a small administrative geography, Bolton has 177.
- Ward population estimates - from ONS. Wards are an electoral geography, Bolton has 20, each of which elects 3 councillors.
- Population estimates ONS bulletin - Report on population estimates by a range of geographies. Click on 'View all data used in this statistical bulletin' to download data for other geographies not given above.
- Population projections - how many people will live in an area in future, by gender and age.
- Population projections for local authorities - from ONS
- Subnational population projection briefing - from ONS
- Subnational population projections methodology - from ONS. Explains how local area population projections are calculated and things to be aware of when using them.
- No population projections are available for areas smaller than local authority.
- Overview of Bolton's population projection
- LSOA population density - from ONS. LSOA is a small adminsitrative geography.
- Admin-based population estimates of internal migration between local authorities, England and Wales - from ONS
- Asylum statistics - by local authority from the House of Commons Library
Further useful information
- Understanding international migration - from the ONS