Life expectancy
Reviewed: 24/07/2025
Life Expectancy at Birth
Life expectancy is an important indicator of overall population health, and inequalities in health.
Nationally, life expectancy figures are prepared by the Office for National Statistics and used to assess and set a number of important health related policies and initiatives that impact on everyday life. Projected life expectancies are used in the process for setting the State Pension Age whilst subnational life expectancies are used to assess inequality between different parts of country and different population groups.
Life expectancy at birth is the average number of years a baby born would be expected to live for if they experienced today’s age-specific death rates for the rest of their life. However it is not a prediction as these factors would be unlikely to remain constant.
Life expectancy in Bolton (2021-23)
Bolton's life expectancy at birth is singificantly worse than England for both males and females. Bolton's life expectancy at birth is significantly worse than NW for males, but similar for females.
| Male life expectancy | Female life expectancy | ||||
|---|---|---|---|---|---|
| Location | Years | vs Bolton | Location | Years | vs Bolton |
| Bolton | 76.7 | - | Bolton | 81.3 | - |
| North West Region | 77.5 | ↑0.8 | North West Region | 81.6 | ↑0.3 |
| England | 79.1 | ↑2.4 | England | 83.1 | ↑1.8 |
Trends in Life Expectancy
A recent report by the Kind’s Fund describes two "turning points" in trends in life expectancy in England in the past decade.
From 2011, increases in life expectancy slowed after decades of steady improvement, prompting much debate about the causes. Then in 2020, the Covid-19 pandemic was a more significant turning point, causing a sharp fall in life expectancy the magnitude of which has not been seen since World War II. (The Kings Fund, 2024)
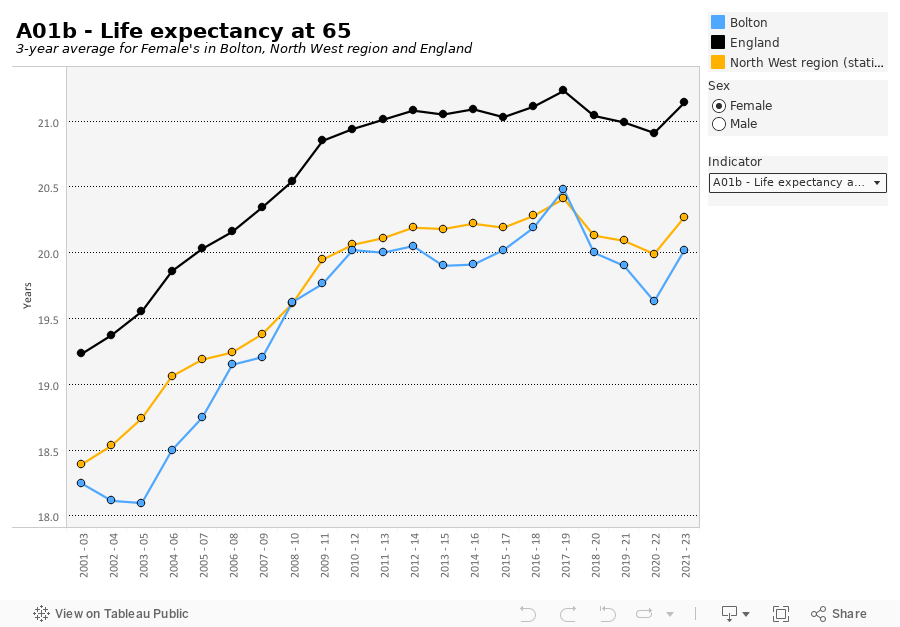
For both males and females living in Bolton, life expectancy at birth has been consistently below the national average since 2001. Bolton's highest male life expectancy was seen in 2014-16, and highest female life expectancy seen in 2017-19.
Inequalities in life expectancy
The link between disadvantage and life expectancy is well documented. People living in more affluent areas live significantly longer than people living in deprived areas. The Slope Index of Inequality (SII) is used to measure the difference between the life expectancy in the most and least deprived areas. Nationally, both males and females have seen statistically significant increases in the inequality in life expectancy at birth since 2015 to 2017 (ONS, 2022).
Small area life expectancy in Bolton (2019-23)
Within Bolton, life expectancy varies by 11.8 years for males and 10.8 years for females between small areas (MSOAs) in the borough.
| Male life expectancy | Female life expectancy | ||||
|---|---|---|---|---|---|
| Value | Location | Years | Value | Location | Years |
| Highest | Bolton 002 (Bromley Cross & Bradshaw) | 82.1 | Highest | Bolton 001 (Dunscar & Egerton) | 87.7 |
| Lowest | Bolton 016 (Central Bolton) | 70.3 | Lowest | Bolton 011 (Halliwell & Brownlow Fold) | 76.9 |
| Difference | - | 11.8 | Difference | - | 10.8 |
The Bolton picture
- Life & death morsel of the month (July 2025)
- Life expectancies for Bolton - from OHID's public health outcomes framework
- Inequality in life expectancy at birth - from OHID's public health outcomes framework
- See the variations in life expectancy along popular bus routes in Bolton here: Life expectancy along bus routes (shinyapps.io)
- Visual showing life expectancy and healthy life expectancy variation in Bolton compared to state pension age
- Small area life expectancy at birth - from OHID
- Life expectancy for local areas of the UK
- Segment tool - from OHID. This shows the deprivation gap between Bolton's most deprived 20% of areas and Bolton's least deprived 20% of areas, alongside health conditions contributing to the gap.
Select 'data' -> 'Geography type' = 'Local authority', 'Region' = 'North West', 'Geography' = 'Bolton'. - Health state life expectancies - from ONS
- Life Expectancy releases and their different uses - from ONS
- Life expectancy downloadable chart (xlsx)
Further useful information
- What's happening to life expectancy in England? - explainer from the King's Fund
- Understanding the drivers of healthy life expectancy - A report summarising several pieces of statistical analysis and findings from a rapid literature review aimed at exploring the drivers of healthy life expectancy, from OHID